Enrollment Nerdery
A place to collect my thoughts on data analysis within Enrollment Management. Dare I call it Enrollment Science?

Predict Competition of Undergraduate Institutions using Neo4j
Intro
The use of graphs to solve business problems is not new, as companies like Amazon, Netflix, and nearly all major social media sites have been doing this for some time. I have been obsessed with graphs for just as long, and after learning as much as I can about analysis of graphs and graph databases, I am finally getting the time to take what I have learned and apply it to real world data problems I face within Enrollment Managment.
In this post, I am going to explore the network structure of competition at the undergraduate level. To get the data, I crawled a popular “College Search Site” to extract the information that I needed. I won’t go into specifics, but the web is one huge dataset, and sometimes you need to be able to write a bot (computer program) to crawl and build your datasets.
In short, this post attempts to predict if one college is “similar” to another by leveraging the other institutions they are simlilar to, and then looking at the connections those schools have as well. For the time being, I am only going to look 1 hop away from the school of interest, but there is so much more that we can do with this type of database.
I am going to leverage Neo4j, a graph database, for this analysis. Neo4j fits perfectly with this use case, as it not only belongs to the NoSQL family of databases, but with only a few lines of code, you can quickly generate recomendations, or predictions, from your graph. Pretty powerful!
Lastly, it’s worth noting that I am only looking at similarity between institutions. A more robust analysis would be the connections students make with these schools. The data exist, but outside of one company, I don’t know if other college search sites are taking advantage of this data structure.
If you work at one of these companies and aren’t sure, reach out. I would love to chat about what we might be able to do! I am always looking for real-world datasets for the academic research I do outside of my role in Enrollment Managment, so maybe we can work together!
The Dataset
As always, I am using R for my analysis. Nicole White has created an awesome R package RNeo4j to connect to Neo4j. I am using that library below to connect to the database and wipe out all my data for a clean environment.
## load the library
library(RNeo4j)

## connect to the graph
graph = startGraph("http://localhost:7474/db/data/")
graph$version

# clear it out entirely
## CAVEAT: deletes the data without user confirmation.  Do not copy and paste!
# cypher(graph, "MATCH (n) RETURN COUNT(n)")
clear(graph, input = F)
Now that we have a clean database, let’s talk about the data.
Lets suppose you have a dataset that looks like this:
| from_unitid | to_unitid | from_rank | from_rating | to_rating |
|---|---|---|---|---|
| 199148 | 198507 | 25 | 4.0263 | 3.7073 |
| 212160 | 213987 | 6 | 3.7730 | 3.8522 |
| 217484 | 217518 | 6 | 3.8444 | 4.2442 |
| 152390 | 151351 | 3 | 3.9082 | 4.0535 |
| 188641 | 196176 | 18 | 3.6977 | 3.5899 |
| 186122 | 190415 | 10 | 0.0000 | 4.5446 |
| 100858 | 221759 | 8 | 4.0607 | 3.9113 |
| 193283 | 195988 | 8 | 3.1148 | 3.4138 |
| 173902 | 160977 | 24 | 4.4167 | 4.5600 |
| 434584 | 102553 | 11 | 0.0000 | 3.3206 |
Here is a description of what these fields represent.
from_unitid: The IPEDSunitidfor the school of interest.to_unitid”: The IPEDSunitidfor the school that is similar tofrom_unitidfrom_rank: A rank-ordered estimate of how similar thefrominstitution is to thetoinstitutionfrom_rating: The rating - out of 5 stars - for theto_unitidschool scraped from the source websiteto_rating: The rating - out of 5 stars - for the similar school
There already has been a ton of research on the prediction of edges (links) in graphs, so my approach to this problem is only scratching the surface, and quite frankly, basic.
Since we are trying to build a model that predicts if one school is defined as smililar to another, we need to remove a small portion of our dataset in order to validate the accuracy of that estimate.
The code below is how I randomly deleted a few edges from our graph in order to retain a test dataset
## ensure that there are 25 rows for each school
tmp = tbl_df(edges) %>% group_by(from_unitid) %>% summarise(num = length(to_unitid))
tmp = filter(tmp, num == 25)
edges = subset(edges, from_unitid %in% tmp$from_unitid)
rm(tmp)

## split into the traing and test dataset
ROWS = sample(1:nrow(edges), 150, replace=F)

## training graph
graph_test= edges[ROWS, ]
graph_train = edges[-ROWS,]
rm(ROWS)

## how many unique schools in the test dataset
length(unique(graph_test$from_unitid))
save(graph_test, graph_train, edges, file="data/graph-data.rdata")
Database Creation
The image below is how we are translating the data into a network graph.
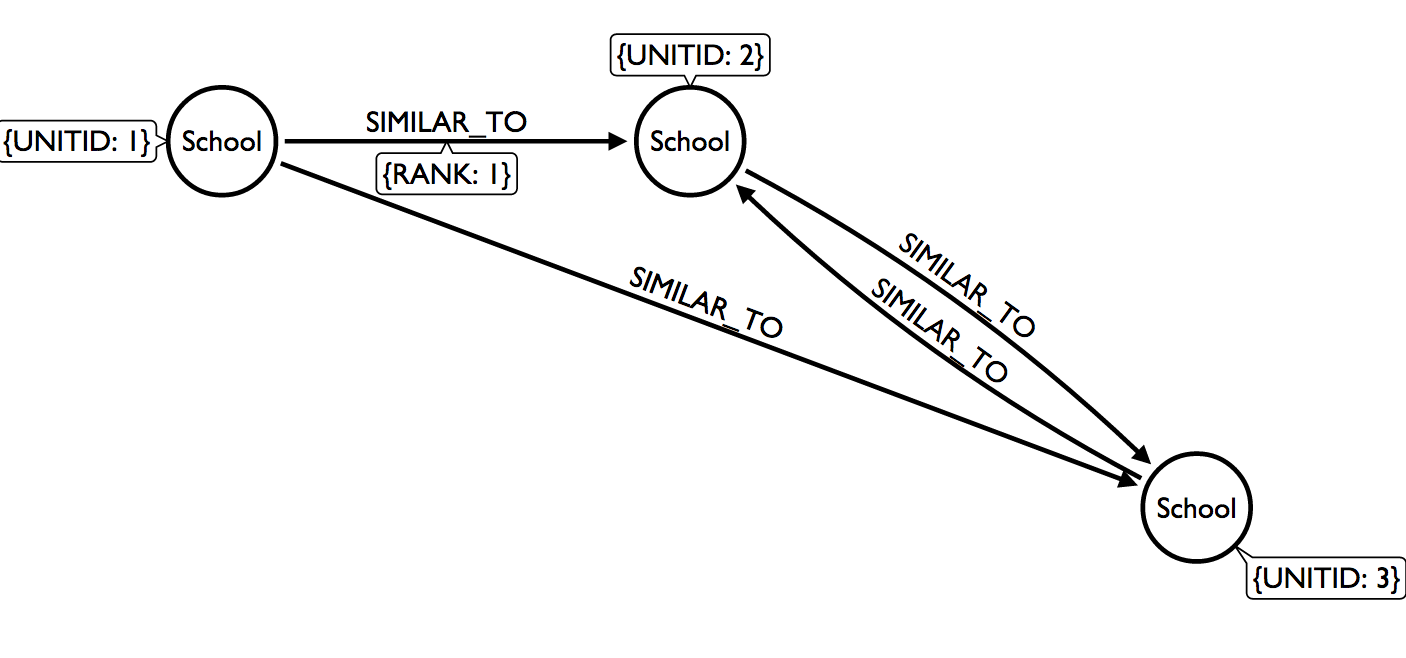
Our dataset is more comparable to Twitter than Facebook. School 1 is similar to School 2, but School 2 isn’t similar to School 1. In graph terms, this is a directed network. Unlike Facebook, where users both agree to to a friendship, our dataset is comprised of connections between institutions that may not be reciprocated.
Because of this, we can start to map out the competitive landscape within higher education. Even though the dataset comes from only one college search site, it’s a start, and allows us to look at who are competitors are competing with. That’s some powerful stuff!
Before we do any analysis, we need to put the data into Neo4j.
## set the constraints first
addConstraint(graph, "School", "unitid")

## the query
query = "
MERGE (s1:School { unitid:{from_unitid} } )
ON CREATE SET s1.rating = {from_rating}
MERGE (s2:School { unitid:{to_unitid} } )
ON CREATE SET s2.rating = {to_rating}
CREATE (s1) -[r:SIMILAR_TO {rank:{from_rank}}]-> (s2)
"

## start the initial transaction
tx = newTransaction(graph)

## just using the small dataset for exploring and valid queries
start = Sys.time()
for (i in 1:nrow(graph_train)) {
 ## for every 500 rows, commit the transaction
 if (i %% 500 == 0) {
  # commit the transaction
  commit(tx)
  cat("Batch ", i/500, " committed \n")
  # open a new transaction
  tx = newTransaction(graph)
 }

 ## create the parameter values
 from_unitid = graph_train[i, ]$from_unitid
 from_rating = graph_train[i, ]$from_rating
 to_unitid = graph_train[i, ]$to_unitid
 to_rating = graph_train[i, ]$to_rating
 from_rank = graph_train[i, ]$from_rank

 ## appead the query
 appendCypher(tx,
              query,
              from_unitid = from_unitid,
              from_rating = from_rating,
              to_unitid = to_unitid,
              to_rating = to_rating,
              from_rank = from_rank)
} #endfor

## committ the last transaction and record the time it takes
commit(tx)
end = Sys.time()
end - start
Using cypher transactions, as I did above, isn’t the fastest way of getting data into Neo4j, but it’s clean and easy to read. For reference, it took a tad over 12 minutes to put our training dataset into the database.
If you need to throw larger volumes of data into the database, you should check out the shell tools that are part of the base install. More specifically, neo4j-shell and neo4j-import.
Explore the data
Now let’s confirm that we have some data.
## make sure we are connected
graph = startGraph("http://localhost:7474/db/data/")

## the number of nodes
cypher(graph,
       "
       MATCH (n)
       RETURN COUNT(n) as `Total Nodes`
       ")
  Total Nodes
1        3477
## summary of the data model
summary(graph)
    This         To   That
1 School SIMILAR_TO School
## how many relationships
cypher(graph,
       "
       MATCH () -[r]- ()
       WITH r
       RETURN type(r), count(*) as total
       ")
     type(r)  total
1 SIMILAR_TO 161860
Finally, let’s look at a quick plot from a small subset of the data
## the query
query = "
MATCH (n)-[r]->(b)
RETURN n.unitid AS from, b.unitid AS to, r.rank AS rank
LIMIT 50
"

## the dataframe
dat = cypher(graph, query)
dat$rand = NULL

## graph the dataframe
g = graph.data.frame(dat, directed = T)

## simple plot
ggnet(g, size=10)
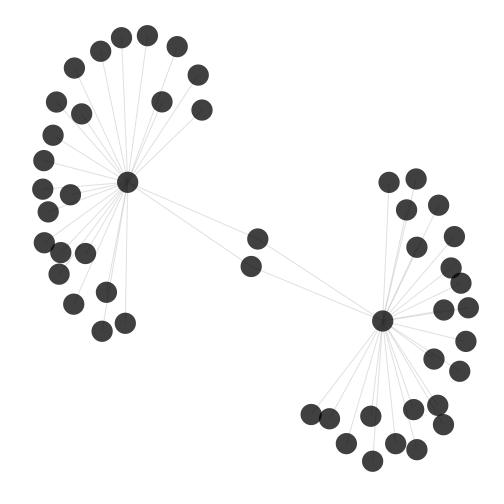
The plot above just pulls out 50 nodes. I won’t go into describing the graph, but I find it interesting that there are two schools that are common to the larger clusters, but these two institutions are not similar to each other.
Predicting Edges
As mentioned above, I wanted to create a very basic predictive model to test if leveraging the structure of the graph is better than just guessing.
I don’t know if it’s my machine, a sub-optimal CYPHER query, or simply the expected run-time, but generating the predictions for 150 schools took nearly two hours. I have had much better performance on larger data, so something doesn’t feel right here.
Let’s take a quick at the predictions to ensure the output matches our expectations.
| from | freq | pred_school |
|---|---|---|
| 218487 | 23 | 218964 |
| 138789 | 11 | 140322 |
| 220127 | 11 | 219602 |
| 420398 | 24 | 229027 |
| 244233 | 9 | 132471 |
| 196006 | 20 | 196176 |
Note that column freq is how many schools were included in the prediction. If we wanted to extend this, a school can have up to 25 SIMILAR schools. With this in hand, you could estimate a confidence of the prediction by freq / 25, or more accuractley, freq / # Schools Similar to. This would yield a percentage, with numbers closer to 1 indicating that nearly all other schools have this recommendation as a competitor.
We finally have what we need!
Results
Let’s see how the recommendation did.
First, in order to measure how well our simple model performs, we need to understand the compared to what question. To create this baseline, we go back to our original dataset, identify the most popular schools, and then select the most popular insitution not already listed by the school of interest. This is just a Top-N prediction.
pop_accurate
FALSE
  150
From above, we can see that the Top-N prediction did not predict any connections correctly, as evidenced by the 150 underneath the FALSE. In reality, if my test set was larger than 150 edges, undoubtedly we would have got a handful of correct guesses.
Now, let’s look at the model.
pred_accurate
FALSE  TRUE
  105    45
From above, we see that the model accurately predicted 45 of the 150 connections. That is 30 % correct, not bad.
Summary
Overall, there is some evidence to suggest that the network structure of the competition higher ed can be leveraged to predict which schools compete with each other. The holdout sample of 150 cases wasn’t that large, but predicting 30% of the cases with a very simple model isn’t a bad start.
Neo4j is a pretty powerful database, but I still have a lot to learn. Generating predictions (recommendations) for 150 cases shouldn’t take nearly two hours. This would never fly in a production environment, but as mentioend above, I suspect that there are some things that I can do on my end to greatly enhance performance. In another study (not published), I was able to generate predictions for 1000 entities in less than ten minutes. Neo4j admits that it’s not an analytical engine, which is why there are some great tools being devolped on top, like Mazerunner which aims to bring graph ETL capabilities to the database.
Stepping back, I am excited to extend the use of Neo4j into other projects within Enrollment Management, as I strongly believe that analyzing our data in graph format can yield strategic insights above and beyond what we can already do with more traditional methods like regression, clustering, and machine learning.
comments powered by Disqus