Enrollment Nerdery
A place to collect my thoughts on data analysis within Enrollment Management. Dare I call it Enrollment Science?

NHL Play-by-Play Viewer using R Shiny
This repo contains my first-ever R Shiny project. It’s simple, and represents a minimally viable app. It’s super basic, but the app allows us to query and visualize the NHL’s Play-by-play event logs for a given game.
I updated the app for the
2015-16season. There are a few manual updates to the code that I could refactor and allow the end-user to set, but in the short run, it works.
The app also leverages a simple shot probability model that I built.
That repo can be found here.
Run the app locally
- If you haven’t already, install
Rhere for your OS. - Open up a terminal, and type
R - When
Ropens, type,install.packages('shiny')into the command line - Assuming that runs without error, run my app by typing
shiny::runGitHub("nhl-shiny", "btibert3")
This should fire up your default modern browser. It will take a few moments to load the data, and will refresh every 20 seconds or so. When you want to quit the app, go back to the terminal and type CONTROL-C to kill the process.
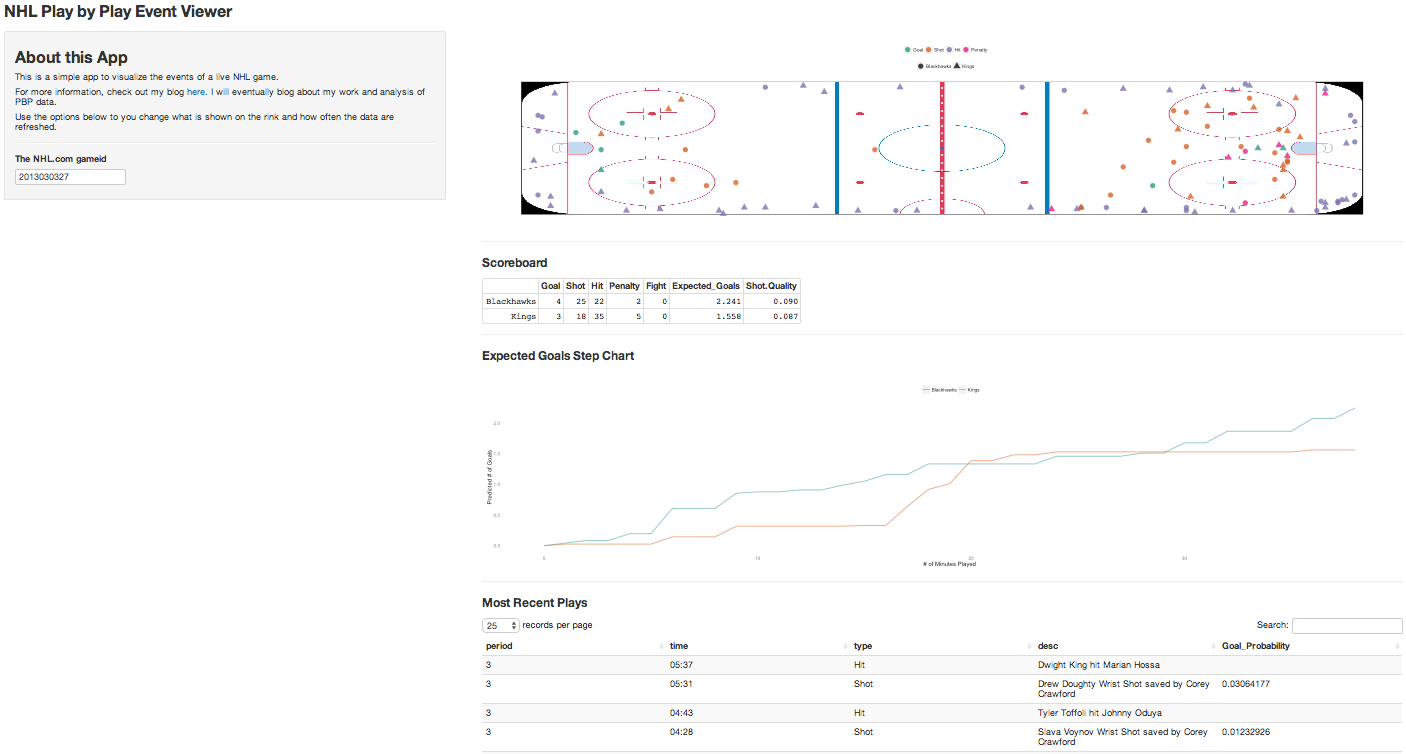
A quick screenshot
Clearly this is very unpolished, but just a quick highlight of the dashboard app.
Notes:
- I have noticed that sometimes the app will fail with
matcherrors on the MainPanel of the dashboard.
– I am not sure if this is the NHL refusing aGETrequest to refresh the data or if there is a bug inShiny.
About the Shot Prediction Model
In my previous repo, I highlight a very proof-of-concept model. It’s not elegant, but very effective when estimating a player’s total season goals. With respect to the point estimates (actual probability of a shot going in), it has some room for improvement; AUC is mid .7’s.
The approach I use is simple: fit a logistic regression to predict a given shot going in goal given:
- the distance,
- shot angle,
- the wing (left/right)
- an interaction between distance and angle
When applying the model to every shot from a player (identified by the NHL playerid), and correlating the actual versus predicted goals over the course of a season, the R-squared is a touch under .9.
TODO:
- [ ] handle invalid gameids gracefully
- [ ] Modify / change the Forecasted Goals stepchart
- [ ] Evaluate if the model should factor in time since last shot (rebounds)
- [ ] Improve the rink plot to be interactive with mouse over detail
- [ ] Better handle games. Need to change the
helpers.Rfor each season.